Is science on the right track
Web Master -
Climate Change
Throughout history our climate has been changing and it will continue changing as it is subject to a complex pattern of cycles, all of which have an effect on out climate. If these factors work against each other they will cancel each other out, but when they work together the effects are quite dramatic. The effects of these cycles can be seen throughout history and prehistory.
In recent years, people have concentrated on a small part of the graph from the beginning of the industrial revolution up to the present day and have noticed a steady rise in temperature. They also noticed a similar rise in the amount of carbon dioxide in the atmosphere and assumed there must be a cause and effect. Correlation does not show cause and effect, it merely shows that two parameters are moving in a similar way.
Greenhouse Effect
When we were at school we were taught about the greenhouse and how it trapped heat from the sun. We all drew the diagram of a greenhouse with high energy rays coming from the sun to heat up the ground inside the greenhouse. We then drew some lazy waves coming off the ground and bouncing off the glass of the greenhouse because the glass was opaque to these lower frequencies. That was where we first went wrong. The heat didn’t bounce off the glass. It was absorbed and slowly conducted out through the glass.
What they overlooked when explaining this was that the heat was lost from the ground, not by radiation but by convection, and as there was a solid container over the ground, the heat could not get out so it got hotter inside the greenhouse. Gardeners all know that on a hot day, you have to open the windows at the top of the greenhouse to release the hot air. The greenhouse then rapidly cools.
Because carbon dioxide has a similar absorption characteristic of the lower frequencies (infrared) that it will also act like a greenhouse. This is so wrong. The carbon dioxide does not provide a rigid container to prevent convection so has no effect on the retention of heat at all, or at least to no measurable extent. C02 is not the only gas that has infra-
Hockey Stick Curve
In recent years, a new temperature curve was produced, using tree-
Interacting Cycles
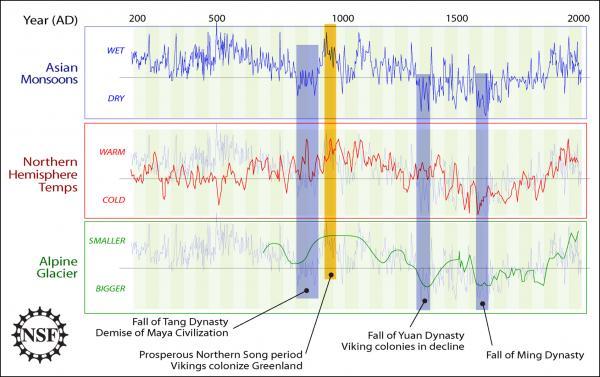
So we come back to the natural cycles of the universe. That sounds a bit mystical, but it isn’t. Nearly all motion in the universe has a cyclic elements to it. The planets go round the sun in a cyclic manner. The tilt of the earth rotates slowly in a cyclic manner. The sun’s heat rises and falls in a cyclic manner and the earth’s orbit also changes in a cyclic manner. We can actually quantify these cycles and if we were to synthesise a waveform by combining all the different cyclic components, we would get a waveform that would represent the temperature of the earth over time. I have done this in a somewhat simplified form to show the temperature of the Earth over the last thousand years and on into the future.


The solid white line, superimposed on the green curve is the reconstituted curve. I accept that there are some discrepancies due to the accuracy of the data sampled, but it shows the general drift, the main factor being that the temperature has reached a maximum and is beginning to decrease. Actual figures published by the Met Office show that the temperature has been virtually constant for the last fifteen years.
This is a well known graph showing the change in climate over the last two thousand years. Using the temperature curve (centre graph) I carried out a Fourier analysis of the wave form to give me all the component cyclic components. I then wrote a computer programme to combine all these components to reconstitute the original waveform. The difference being that the reconstituted wave does not stop at the year two thousand but carries on beyond. The result showed that the temperature had already reached a maximum and was starting to decrease again.
